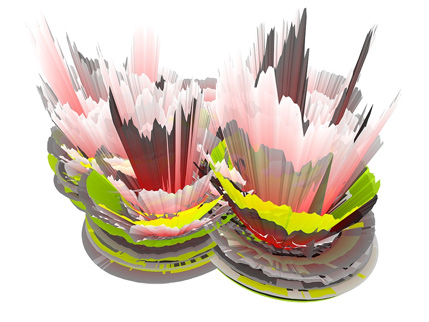
Urban Water Needs by Hal Watts and Matthew Laws.
As we accumulate more data on items of global concern, rapid visualization of this data becomes paramount. Policy-making via current political systems is too slow to react to data and the rapidly changing environment it measures. Open data would allow community-based data visualization and interpretation. Policy making is left up to the individual based on the latest data and interpretations.
Wednesday, March 30, 2011
Sunday, March 27, 2011
Sometimes it takes me a while to find good parallels. If this rings a bell with you then please, feel free to mix, match, compose, create in a similar way, and then send me a link to your work. We can assemble a collection of all compositions, wild and wonderful. The last time was the comparison of protein schematic structures with whale feeding swimming patterns. This time compares the work of data visualizer
Marius Watz (NO) with the psychedelic/optical illusion paintings of Franz Ackermann (DE). Have fun and be sure to let me know of any thoughts.
Marius Watz (NO) with the psychedelic/optical illusion paintings of Franz Ackermann (DE). Have fun and be sure to let me know of any thoughts.
Thursday, March 10, 2011
Visualizing the Egyptian Influence Network
Based on Twitter timestamps of who follows who with a tweet. If this is possible, imagine the depth of visualization capable from a database such as Facebook...
http://www.visualnews.com/2011/02/14/visualizing-the-egypt-influence-network/
http://www.visualnews.com/2011/02/14/visualizing-the-egypt-influence-network/
Subscribe to:
Posts (Atom)


